

Embrace the Retrace
Trading retracements
Retracements are often viewed as something traders should fear.
You are in a strong trend, the market starts moving against you, and suddenly the question becomes: Is the trend over?
But what if the retracement is actually part of what allows the trend to continue?
Markets rarely move in a straight line. A strong advance will often experience a pullback before making a new high. A strong decline may rally before making another low.
There is a reason for this.
A retracement can change the positioning of the market. As traders take profits and reduce their positions, the market becomes less crowded. When the original trend resumes, there may be fewer existing positions taking profits in the opposite direction to absorb fresh buying or selling. That can make it easier for the market to extend the trend.
This is the common-sense way to think about retracements.
Trading retracements – Why Do Retracements Work?
Let’s start with the question traders often ask about Fibonacci retracement levels:
Why do they work?
Is there something magical about 38.2%, 50%, or 61.8%? No.
These are not supernatural levels. They matter because they are widely watched. The more traders, investors and market participants who use the same technical reference points or indicators, the more attention those levels can receive and thus they increase in importance.
When price reaches one of these areas, traders may react depending on whether the level holds, breaks, or produces a change in price behavior.
In that sense, Fibonacci levels can become something of a self-fulfilling reference point. But the Fibonacci number itself is not the reason a market must reverse. The more important question is what is happening to the market around that level.
- Is buying coming in?
- Is selling increasing?
- Has momentum stalled?
- Are traders taking profits?
- Has the market’s positioning changed?
These are the questions that can help explain what happens next.
Fibonacci Levels Are Reference Points, Not Magic Numbers
Fibonacci retracement levels are useful because they give traders a common framework for measuring a pullback.
The most commonly watched levels include:
- 23.6%
- 38.2%
- 50% (not a Fibonacci level but widely watched0
- 61.8%
- 78.6%
Of these, the 38.2%, 50%, and 61.8% areas are a main focus.
But a trader should not look at a Fibonacci level and automatically assume the market will reverse. Instead, think of the level as an area where you should pay attention.
If price reaches a widely watched retracement level and stalls, that can become interesting.
If price breaks through it with strong momentum, that tells you something different.
The level gives you a reference while price action tells you what the market is actually doing.
Trading retracements – The Real Reason a Retracement Can Be Necessary
This is where the concept becomes more interesting.
Imagine a market moving strongly higher.
As prices rise, more traders become long. Traders who bought earlier now have profitable positions. At some point, some of those traders will want to take profits.
Taking profits on a long position means selling.
Those profit-taking sellers can provide liquidity that helps absorb some of the fresh buying entering the market.
As the market continues higher, however, more traders may take profits and reduce their positions.
Eventually, the market can reach a point where the existing trend becomes crowded and the balance of orders begins to change.
- Momentum can slow.
- The market may then retrace.
And that retracement serves an important purpose.as it trims positions and resets the market.
The Positioning Reset
Consider a strong uptrend.
Early buyers are sitting on profits. As the market rises, some sell to take those profits.
Then the market pulls back.
During that retracement, more traders may reduce their long positions, while others who were waiting for a better entry may begin preparing to buy.
By the time the retracement has run its course, the market may have significantly different positioning than it had at the peak of the previous advance.
Now imagine fresh buying begins again.
There are fewer existing long positions left that need to sell and take profits.
In other words, there may be less opposing selling flow available to absorb the new buying, which in turn hat can make it easier for the market to move higher.
This is an important part of why a retracement may be needed before a strong trend makes a new high.
The Same Logic Works in a Downtrend
Now turn the example around.
- Imagine a strong downtrend.
- As the market falls, traders build short positions.
- Existing shorts eventually need to buy back their positions to take profits.
- Those taking profits provide buying that can absorb some of the fresh selling entering the market.
- But eventually, many of those short positions may be closed or reduced.
- The market then has fewer existing shorts left that need to buy back their positions that can help reset the market.
- Once the retracement stalls and fresh selling returns, there may be fewer buyers taking profits from existing short positions.
- Key takeaway: That means there can be less opposing buying available to absorb the new selling.
- The market may therefore have an easier time moving lower and breaking to a new low.
This is the key market dynamic behind the retracement.
Trading retracements – Think of a Retracement as a Reset
A useful way to visualize the process is:
Strong Trend → Positions Build → Profit-Taking Increases → Momentum Stalls → Retracement → Positions Are Trimmed → Fresh Trend Flow Returns → New High or Low
The retracement isn’t necessarily a failure of the trend. It can be part of the process that prepares the market for its next move in the direction of the trend.
This is why traders shouldn’t automatically panic when a strong trend begins to pull back.
Sometimes the market simply needs to clear out existing positions before it can absorb another wave of directional orders.
The “Shakeout” of Weak Positions
This is also where the idea of a shakeout comes into play.
When a market has moved strongly in one direction, some traders will have positions that are more vulnerable than others.
A retracement can force weaker participants out of the market.
In an uptrend, some longs may exit during a decline.
In a downtrend, some shorts may cover during a rally.
But the important point is not simply that weak traders are removed. The bigger issue is what happens to the market’s ability to absorb new orders afterward.
Once positions have been reduced, an imbalance is corrected making it more difficult to absorb new flows.
That is why a retracement can be more than just a temporary move against the trend. It can change the conditions under which the next move takes place.
How to Trade Retracements: Look Beyond the Chart
This leads to a common-sense approach to retracement trading.
Instead of looking at a chart and reacting mechanically whenever price reaches a Fibonacci level, step back and consider the market dynamics.
Ask yourself:
- What was the trend before the retracement?
- Has there been any news to suggest that this is a reversal rather than a retracement?
- How extended was the previous move?
- Who is likely taking profits?
- Has the market had enough time to reduce existing positions?
- Where is the retracement beginning to stall?
- What happens when fresh buying or selling returns?
- Can the market make a new high or low?
The answers can tell you much more than the Fibonacci percentage alone.
The End of the Retracement Is the Important Part
Suppose you have a strong downtrend.
- The market begins to rally.
- That rally is the retracement.
- Eventually, the rally stalls.
- At that point, you want to see what happens when sellers return.
- If the market begins falling again and eventually breaks the previous low, that tells you the original downtrend has regained enough momentum to extend itself.
- The market has moved through the retracement, reset positioning and found fresh selling.
- The new low is important because it confirms that the market has been able to absorb the new selling and continue the trend.
The same principle applies in an uptrend.
The market advances, retraces lower, stalls, and then buying returns.
If price eventually breaks above the previous high, the market has demonstrated that the uptrend can continue.
What If There Is No New High or Low?
This may be one of the most useful clues a retracement can provide.
Imagine a strong downtrend.
The market rallies in a retracement, stalls, and then begins moving lower again.
You expect a new low.
But it doesn’t happen.
The market sells off but cannot break the previous low.
That should make you pay attention.
Why?
- Because the expected trend continuation isn’t occurring.
- There may still be enough buying interest in the market to absorb the fresh selling.
- Perhaps the retracement did not sufficiently reset positioning.
- Or perhaps the original downtrend is simply running out of steam.
The same applies to an uptrend.
If the market retraces lower and then rallies but cannot make a new high, the inability to extend the trend can be a warning sign.
It does not automatically mean the market is reversing.
But it does tell you that something may have changed.
Trading Psychology: Why Discipline Matters More Than the Perfect Strategy
Retracement Versus Reversal
This is an important distinction.
A retracement is a move against the trend.
A reversal is a change in the trend itself.
The challenge for traders is determining which one they are seeing.
One way to think about the difference is to watch what happens after the retracement.
If the market resumes the original trend and makes a new high or low, the retracement may have simply been a correction within the existing trend.
If the market cannot extend the trend and begins breaking important levels in the opposite direction, the probability of a larger change in market structure may increase.
Again, this is not about predicting the future with certainty. It is about observing what the market is actually doing.
Trading retracements
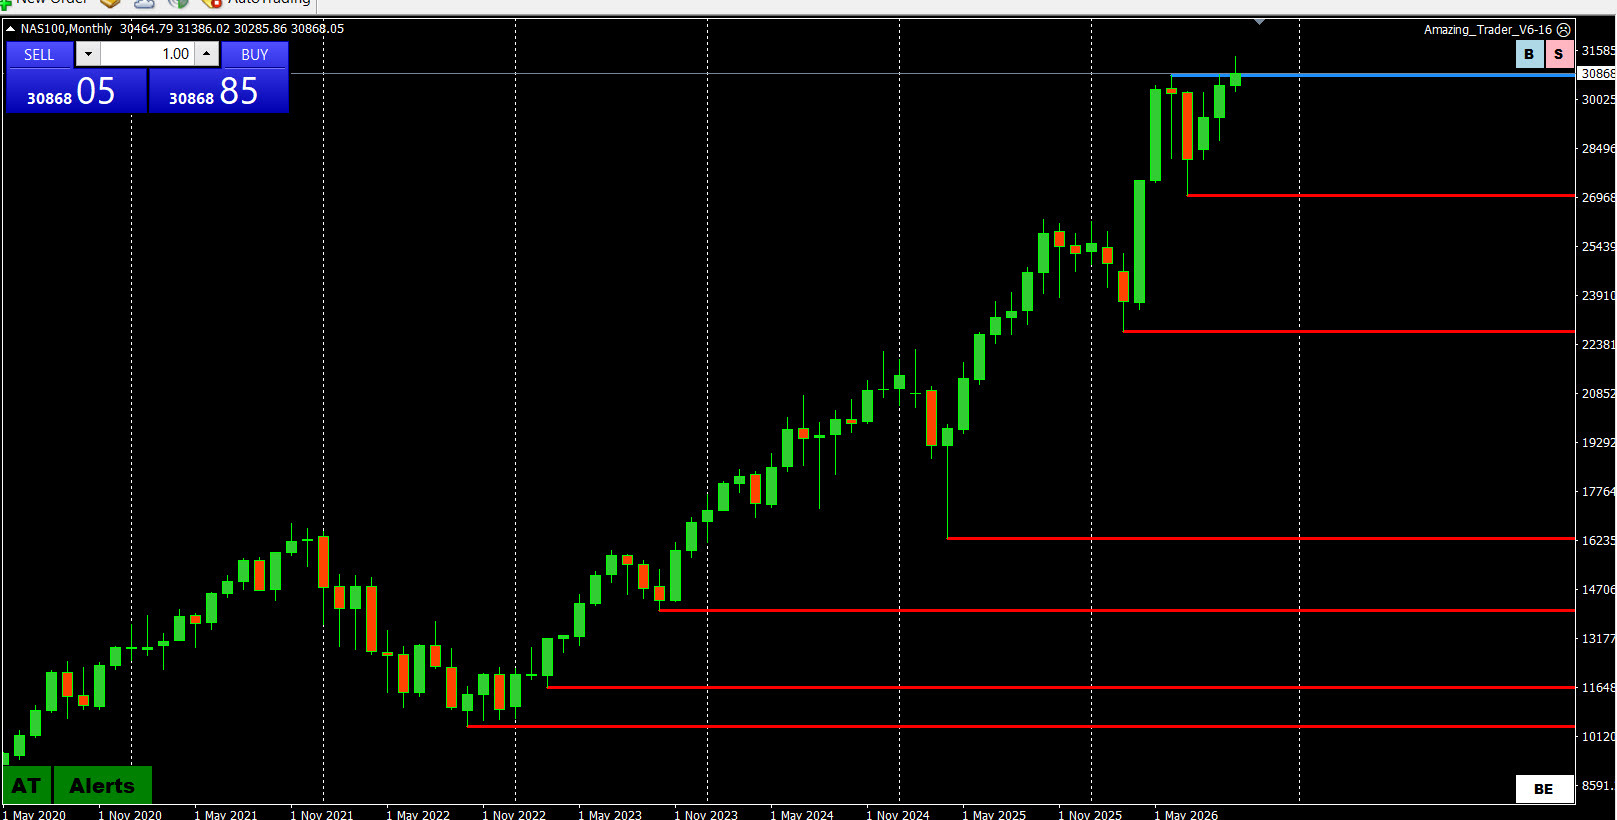
Illustration: NAS100 Monthly Chart
Each retracement (as indicated by the red lines) has been followed by a new high. Deeper the retracement, sharper the snapback with the trend.
Trading retracements – Why Price Action Matters More Than the Fibonacci Number
Fibonacci retracement levels can be useful reference points but they should not be treated as standalone signals.
A 61.8% retracement does not automatically mean “buy.”
A 38.2% retracement does not automatically mean “sell.”
The market may stop at one level, move through another, or ignore Fibonacci levels altogether.
What matters is how participants respond.
- If price reaches a widely watched level and stalls, that is information.
- If it breaks the level with conviction, that is information too.
- If the market reverses and then breaks the previous high or low, that provides another piece of information.
The goal is to use the retracement as a framework for understanding market behavior rather than as a mechanical prediction tool.
Trading retracements – Embrace the Retrace
Retracements are not your enemy.
In a strong trend, they may actually be necessary.
Markets need to rebalance. Traders take profits. Positions are reduced. Weak hands are removed. The balance between buyers and sellers changes.
That process can leave the market with fewer existing positions taking profits in the direction opposite to the next move.
When fresh buying or selling then enters the market, there may be less opposing flow available to absorb it.
That is when the market can potentially make its next significant move.
So the next time a strong trend begins to retrace, don’t automatically assume the trend is over. Instead, ask what the retracement is accomplishing.
Is it simply correcting price or is it resetting the market for the next move? That is the real opportunity in understanding retracements.
Trading retracements
To sum up, the value of a retracement is not simply that price has moved a certain percentage of the previous trend. More important is what the retracement does to market positioning.
As a strong move develops, traders take profits and positions accumulate and are eventually reduced. When the market retraces, it can trim those positions and change the balance of orders.
Once the retracement ends, fresh buying or selling may face less opposing profit-taking flow than it did during the original move.
That can make it easier for the market to push toward a new high or low.
Fibonacci levels can help traders identify areas where this process may become visible because so many market participants watch them but there is no magic in the numbers.
The real story is the interaction between price, positioning, profit-taking, liquidity and fresh orders.
So embrace the retrace.
In a strong trend, the pullback may not be a problem to overcome.
It may be exactly what the market needs before it can make its next high or low.
Trading involves risk. Retracement patterns, Fibonacci levels and technical analysis are not guarantees of future price movements. Always consider market conditions and appropriate risk management before entering a trade.
The post Embrace the Retrace: How to Turn Market Pullbacks Into Trading Opportunities appeared first on Forex Trading Forum.
