
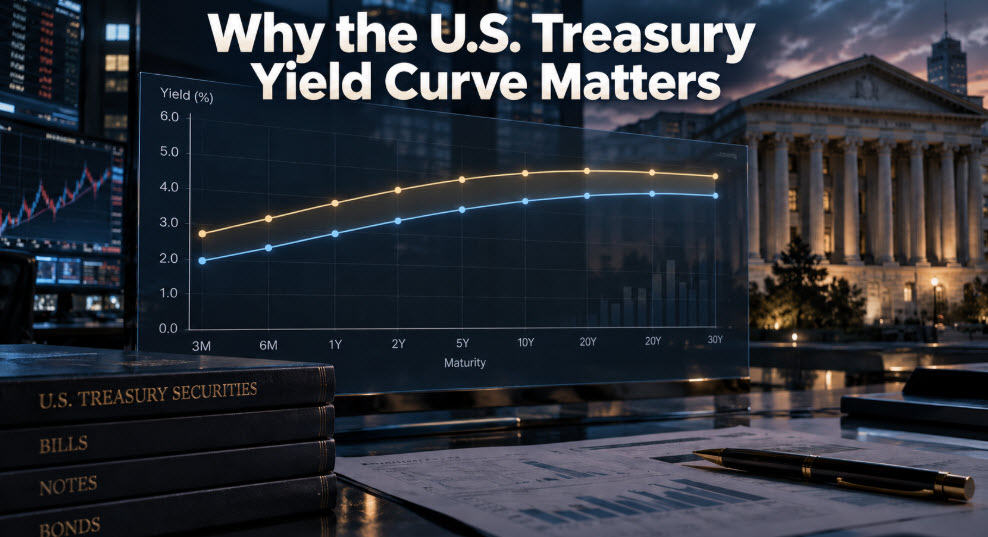

U.S. Treasury yield curve – The sharp rise in long-term U.S. Treasury yields has placed the bond market, particularly the yield curve, at the center of attention.
The benchmark 10-year Treasury yield recently moved above 5.00%, reaching its highest level since 2007. Several factors have contributed to the increase, including persistent inflation, higher energy prices, expectations of additional Federal Reserve rate increases, large federal budget deficits, heavy Treasury issuance and corporate borrowing connected to artificial-intelligence investment.
U.S. Treasury yield curve – An important distinction must be made: the United States has more than $40 trillion in total federal debt, not an annual budget deficit of $40 trillion. The budget deficit is the amount added to the debt during a fiscal year when government spending exceeds revenue.
Although long-term yields have risen, short-term yields have increased even faster. This has flattened the Treasury yield curve and raised questions about what the bond market may be signaling for the economy.
What Is the U.S. Treasury Yield Curve?
Source: Investopedia
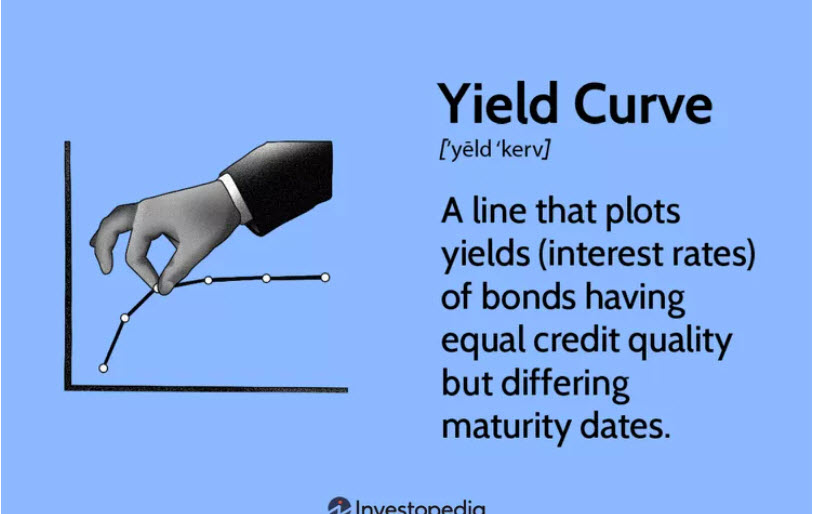
The U.S. Treasury yield curve compares the yields on government securities with different maturities, ranging from short-term Treasury bills to 30-year Treasury bonds.
Under normal conditions, longer-term securities offer higher yields than short-term securities. Investors generally demand additional compensation for lending money over a longer period because they face greater uncertainty about inflation, interest rates and economic conditions.
A normal yield curve therefore slopes upward. A flat curve develops when the difference between short- and long-term yields becomes unusually small. An inverted curve occurs when short-term yields rise above long-term yields.
The yield curve is more than a picture of current interest rates. It is a forward-looking map of what bond investors expect may happen to inflation, monetary policy and the economy.
U.S. Treasury yield curve – Why the 2-Year, 10-Year and 30-Year Yields Matter
Two widely followed sections of the curve are the differences between the 2-year and 10-year yields and between the 2-year and 30-year yields.
The 2-year yield is strongly influenced by expectations for Federal Reserve policy. The 10- and 30-year yields reflect a broader combination of expected short-term rates, economic growth, inflation, Treasury supply and the term premium investors demand for holding longer-term debt.
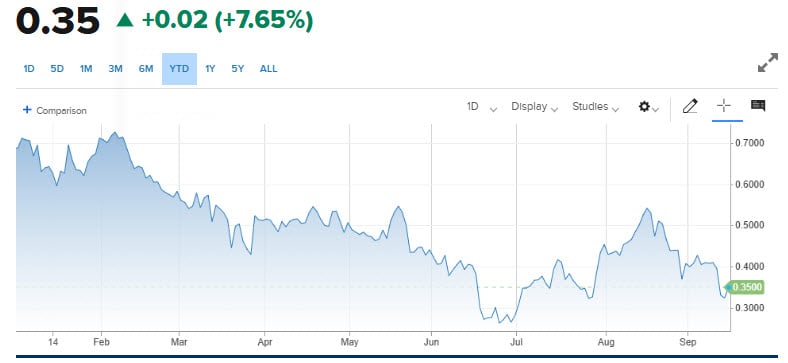
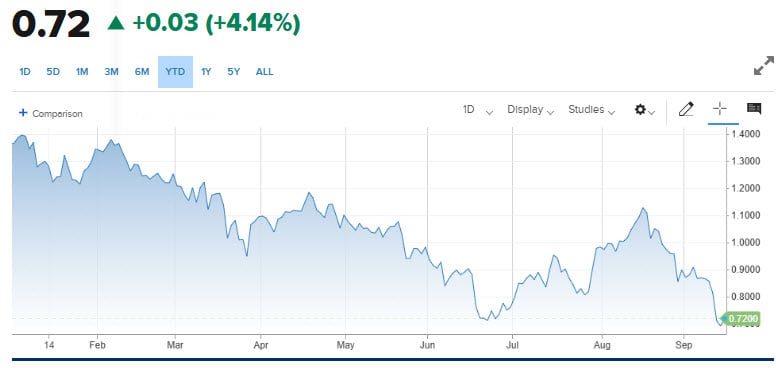
The 2-year/10-year spread have currently narrowed to approximately 35 basis points, while the 2-year/30-year spread narrowed to around 72 basis points. One basis point equals 0.01 percentage point.
These narrowing spreads tell us that short-term yields have been rising more quickly than long-term yields even though longer-term borrowing costs are also increasing.
10 vs 2 year U.S> Treasury yield spread
30 vs 2 year U.S> Treasury yield spread
Source: CNBC
U.S. Treasury yield curve – Why the Yield Curve Is Flattening
A flattening yield curve does not necessarily mean long-term yields are falling. The curve can flatten while yields across all maturities are rising.
The present move is an example of a bear flattening. In the bond market, falling bond prices and rising yields are generally described as bearish. A bear flattening occurs when yields rise across the curve but short-term yields increase faster than long-term yields.
This often happens when investors expect the Federal Reserve to tighten monetary policy aggressively.
The market may believe that persistent inflation will force the Fed to raise short-term interest rates several times. At the same time, investors may doubt that the economy can withstand those higher rates indefinitely.
The curve may therefore be delivering two messages:
- Inflation remains a serious near-term problem.
- The rate increases needed to control inflation could eventually weaken the economy.
Bond investors may already be looking beyond the next round of Fed tightening and preparing for the economic slowdown that could follow.
What a Bear Flattening May Signal
The combination of rising yields and a flatter curve suggests the bond market is concerned about both inflation and future growth.
Higher short-term rates affect credit cards, business loans and other forms of borrowing. Elevated long-term yields also push up mortgage rates and corporate financing costs.
If these conditions persist, households and businesses may reduce spending and borrowing. Economic growth could then weaken even if inflation remains too high for the Fed to cut rates.
That would leave the central bank in a difficult position: maintaining restrictive monetary policy to fight inflation while the economy loses momentum.
Treasury Buybacks and “Operation Twist”
It is unclear how much influence Treasury Secretary Scott Bessent’s debt-management strategy has had on the shape of the yield curve, although the curve has flattened since the policy change was announced in August 2026.
The Treasury increased the size of its long-term liquidity-support buybacks, allowing it to repurchase more older, less actively traded long-dated securities. At the same time, greater reliance on short-term Treasury bills to meet financing needs can shift more government borrowing toward the short end of the curve.
The combination of purchasing longer-dated bonds while issuing more short-term debt has been described by market commentators as a form of “Operation Twist.”
However, the current strategy is not identical to the Federal Reserve’s earlier Operation Twist programs. It is also important to note that “Operation Twist” is a market description rather than the Treasury’s official name for the buyback program.
These operations can improve Treasury market liquidity and may place some downward pressure on long-term yields. However, they cannot permanently overcome larger forces such as inflation, Federal Reserve policy, government deficits and the overall supply of Treasury debt.
How Interest Rates Affect Financial Markets and Traders
What Traders and Investors Should Watch
The yield curve is an important forward-looking indicator, but it should not be viewed in isolation.
A flattening curve becomes more concerning when it is accompanied by weaker employment, tighter credit, rising delinquencies and declining consumer spending.
If economic activity remains resilient, the curve may instead be warning that inflation and interest rates will remain higher for longer.
Why the Reason the Yield Curve Moves Matters Most
The Treasury yield curve appears to be sending two messages at the same time.
First, inflation, government borrowing and expectations of further Fed tightening are pushing yields higher. Second, the flattening curve suggests investors may doubt the economy’s ability to withstand those higher borrowing costs indefinitely.
A flat curve does not guarantee a recession, and a 10-year yield above 5.00% does not automatically signal a financial crisis. However, the combination of elevated long-term yields, rapidly rising short-term yields and narrowing spreads suggests that the economy’s margin for error is becoming smaller.
Looking ahead, the most important question is not simply whether the curve steepens or flattens. It is why the change occurs.
A bull steepening caused by declining inflation and expected Fed rate cuts could signal that monetary restraint is working. In a bull steepening, yields fall across the curve, but short-term yields decline faster than long-term yields.
A bear steepening driven by worsening inflation, heavy Treasury supply or fiscal concerns would send a more dangerous message. In that situation, long-term yields would rise faster than short-term yields as investors demanded greater compensation for inflation and fiscal risk.
The yield curve cannot predict the future with certainty. Nevertheless, it can reveal where bond investors see risks developing—often before those risks become obvious in the economy or other financial markets.
