

Michael Oliver has been analysing financial markets for more than 50 years, a career that covers almost the entire monetary era since the US ended the dollar’s last link to gold in 1971.
He joined BullionStar’s Claudia Merkert at a time when many investors are doubting their precious metals positions. The Fed raised rates again in mid-September, which few had expected so close to the meeting. The 10-year Treasury yield has since pushed above 5.3%, and gold and silver have come under renewed pressure after appearing to bottom in July.
Oliver isn’t rattled. He sees a much bigger story unfolding: a government bond crisis spreading across the US, France and Japan, which he describes as a “nuclear event” for markets. In the interview, he explains why the Fed’s rate decisions won’t decide gold’s direction, why the recent sell-off looks nothing like 2011, and why he believes silver has only just broken out of a 50-year box.
A Government Bond Crisis “We Haven’t Had in 100 Years”
When Claudia asked about the Fed’s September rate hike, Oliver went straight past the rate decision to what he sees as a much bigger story. For the past year his firm has been tracking what he calls the onset of a major government bond crisis. It used to be easy to dismiss that as a Japanese problem. Now it has spread to the US, France and, in his view, most of the Western world.
“We have a government bond crisis. We haven’t had one of those in 100 years. We’ve had a mortgage crisis, we’ve had a dot-com bubble, we’ve had all kinds of things that break the stock market, but we’ve never had a nuclear event like this.”
Oliver says his work picked up the danger early. He warned of a bond yield crisis in January. Long-term yields had then spent two and a half to three years stuck at high levels without breaking in either direction. In April, with the nearby Treasury bond futures contract at around 114, he concluded the base would fail. The contract has since fallen to around 102–103, and the 30-year Treasury yield has risen to about 5.6%.
He argues this crisis differs from earlier ones because it strikes at the foundation of the system itself. Once confidence in a government’s own debt starts to crack, as it has with talk of a possible French default, every other market story comes second.
“If you’re the central bank and your government debt market is coming into total doubt as to its integrity and viability… that’s a nuclear event. That overcomes AI, any issue you want to put on the table.”
Yet most investors, he notes, are still focused on AI, earnings, and the handful of mega-cap stocks pushing the S&P 500 to new highs.
Why the Fed Won’t Decide Gold’s Direction
Many investors have blamed this year’s pullback in gold and silver on the Fed’s return to rate hikes. Oliver dismisses that idea outright. He calls the talk of further tightening “silly”, and he argues that the link between Fed policy and the gold price falls apart when you look at the long-term record.
He points to the 1970s. From the 1976 low to the January 1980 peak, gold rose from around $100 to $850, while the Fed pushed short-term rates sharply higher. Commodities rallied strongly over the same period. The stock market was the one that suffered.
“So the notion that, oh, they’re gonna raise rates, well, first off, are they really? And two, even if they did, that doesn’t determine gold’s outcome.”
He argues the timing doesn’t fit this time either. Gold peaked in January, months before the Fed started raising rates again, so the hikes can’t explain the sell-off. Oliver warns that investors who stay out of gold because of the Fed are making a mistake that “is probably gonna blow up in their face.”
He is also open about where his own call went wrong. He expected a sharp sell-off at some point during the bull trend, but thought it would come in the spring rather than at the January high.
Print or Let It Burn
If the bond market is in crisis, Oliver argues, the Fed is not really choosing between hiking and holding. The real choice is whether to step in and buy government debt or let the market break. He believes central banks will end up following Japan, which has spent years printing money to support its own bond market.
“What are they gonna do, twiddle their thumbs and let it burn? No, they’re not, of course. And tightening rates doesn’t help it. The Japanese route is what they’re all gonna have to do.”
He sees signs it has already started. US M2 money supply is growing faster than usual, which tells him the Fed is already buying. He expects that buying to increase as the crisis shows policymakers how little control they have.
The pressure won’t stay in government bonds, he warns. Oliver is watching the financial sector closely, especially the big banks and the broad financial sector ETF (XLF). On a price chart these look stable. On his momentum charts, he says, they are close to breaking.
“When you look at the price charts, you don’t quite see the vulnerability. When you look at the momentum charts, you see a structure from hell right below their feet.”
A break there would lead to a sharp drop in a sector central banks cannot afford to let fail. He also flags US commercial real estate, a heavily indebted sector that he says is technically very vulnerable and that hardly anyone is talking about.
History suggests what comes next. In the 2023 regional banking crisis, bank shares collapsed while gold rallied. After Lehman Brothers failed in 2008, the Fed didn’t tighten. It started quantitative easing, and gold was soon back near its highs. Oliver thinks we are in a similar position now, except this time the problem is government debt rather than the banks.

Reading Momentum, Not Price
To see why Oliver stays so confident while many others turn bearish, it helps to know how he reads markets. Most investors look at a price chart, often with a 50-day or 200-day moving average laid over it. Momentum Structural Analysis, the method behind his firm of the same name, works differently. It measures price against a set of moving averages and plots the result as its own chart. On that chart, trendlines, support levels and breakdowns can show up long before they appear on a conventional price chart.
Oliver doesn’t use the method to trade the swings of two or three weeks, or even two or three months. Those happen in any trend, bull or bear. What matters to him is whether a long-term trend is still intact. Gold’s bull trend, by his measure, has now run for around 11 years, and the question is what this year’s sell-off has done to it.
“The question is, did that break damage the integrity of the bull trend when you look at it from a long-term technical perspective?”
His answer depends on separating timeframes. On intermediate measures, such as monthly momentum against a three-month average, the sell-off did break some structures. On the long-term measures that define the bull market, it broke nothing.
The same approach explains his trigger levels. Oliver’s buy and sell signals often sit at prices that look unremarkable on a standard chart but mark key breaks on a momentum chart. We come back to those levels in the sections that follow.
Why This Isn’t 2011
For many precious metals investors, 2011 is the comparison that hangs over any sharp sell-off. Silver peaked first, gold kept rising for several more months, and what looked like a correction became a bear market that lasted years. Oliver’s momentum work turned bearish then, when most investors were still optimistic, and he says the signal that told him so is absent today.
That year, his annual momentum chart showed a long-term uptrend line connecting eight separate points, invisible on a normal price chart.
“On a price chart, you couldn’t see it. On a momentum chart we could see an eight-point trend line that a kid with a crayon could draw.”
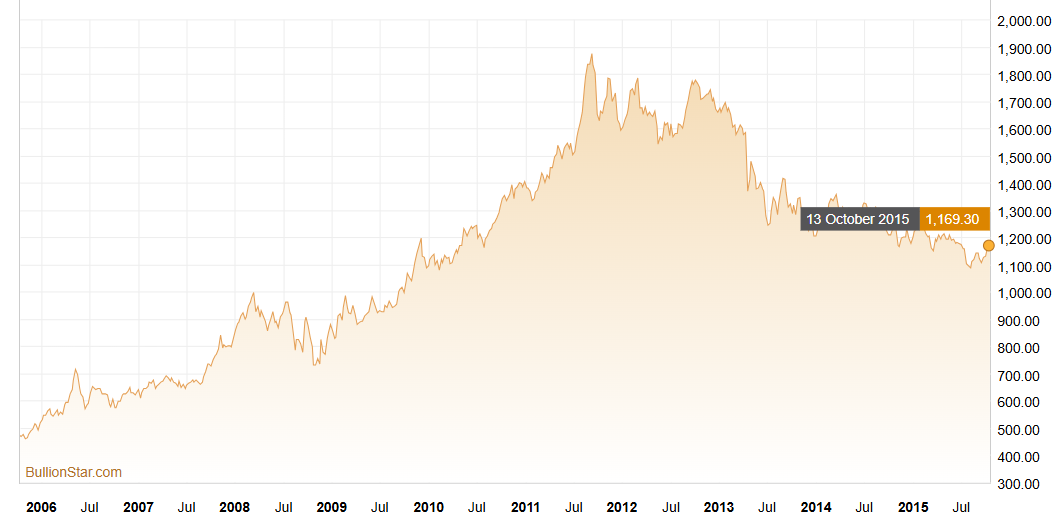
Gold peaked in September 2011 at around $1,920. A couple of months later, that momentum structure broke. Gold never got back to its high, or even to $1,800. Rally after rally failed in the $1,700s, and the market eventually gave way.
This year, the long-term momentum structure is intact.
“We had a clear annual momentum structural break. In other words, you broke something. This break didn’t break anything.”
Oliver accepts that a 30% fall looks severe, but says gold has had several falls of that size since its bull run began in 2015. He also points to 2008. Gold had just reached a record of around $1,000 when it was dragged down with stocks in the October crash, ending roughly 30% below its high. Many investors assumed the bull market was over. Within months, gold was back near its peak.
Three Waves Down and the Levels to Watch
Claudia pointed out that other well-known technical analysts, including Gareth Soloway and Chris Vermeulen, have described scenarios in which gold falls to $3,500 or even $3,100 and silver drops below $50. Oliver said that even moves of that size wouldn’t damage the long-term trend. But he doesn’t expect them.
On his intermediate momentum charts, gold and silver have now completed three distinct waves down, which in his experience is usually as far as a move goes. In June, both metals made new price lows, only slightly below their March lows. Momentum did not follow them lower. He calls this a “non-confirmation”, and it suggests to him that selling pressure is running out.
“I’d be a bit surprised if we make a new low this time… I’m suspecting that this pullback will somewhat surprise people in that it doesn’t make a new low.”
He notes how one-sided sentiment has become. His son Brett follows around ten popular online analysts, and Oliver says all of them are now strongly bearish. Oliver doesn’t describe himself as a contrarian. Still, he points out that the price lows since February have each been only marginally lower, and the pullback since silver’s recent high near $71 has been a slow drift rather than a collapse. To him, that means someone keeps buying the dips.
The real question, he says, is what happens when the metals turn up again. Most investors won’t believe the recovery until gold is back above $5,600 and silver above $120. Oliver’s triggers are much closer: around $4,500 for gold and the mid-$70s for silver.
“If you see that again, they’re gonna blow your head off. We’re gonna come out of here in a thunderbolt.”
He thinks that breakout could come within the next month or two.
Silver’s Prison Break
Claudia noted that silver has held up better than gold during the pullback, even though central banks buy gold, not silver. Oliver’s explanation starts with history. Silver has served as money for thousands of years, often called “poor man’s gold”. Yet for most of the past half-century it has been stuck in a box, both in price and against gold.
He measures silver as a percentage of an ounce of gold. For about a decade, that measure stayed within a tight range. In November, when silver closed at $56, it broke out. Within roughly two months silver went from $56 to $120. Oliver calls it silver’s first “prison break”. It came after a run of signals he had given subscribers: at $26 in March 2024, $35 in June 2025, and $56 in November.
He doesn’t read the January peak and the pullback since as the end of the move.
“What we saw in January… was not the end of something. It was silver screaming, ‘I’m out of here.’”
The pullback in price has been sharp, he notes. Against gold, though, silver has not fallen back into its old range. That is why he expects silver to “vastly outpace gold” in the next leg up.
Oliver’s targets come from several measures that point the same way. Copper trades around six times its 1980 price, yet silver is only modestly above its 1980 high of $50, despite what he says is a six-year supply deficit. On a log-scale chart, silver’s 50-year range spans roughly tenfold. Projecting that range above the $50 ceiling gives a target of around $500. Measuring silver against the growth in money supply since 1980 or 2011 gives similar figures.
He doesn’t think high prices will choke off demand. Much industrial silver is used in such tiny amounts that recycling it isn’t worth the cost. Industry has also kept using copper, lead and zinc at prices far above their 1980 and 2011 levels. He also doesn’t expect the move to take years: in a “global emergency situation”, he thinks it could unfold over several quarters.
Gold Isn’t Going Up, Paper Money Is Going Down
Having watched the entire post-1971 monetary era unfold, Oliver argues that the news-driven explanations investors reach for, such as rate hikes, stock market swings and headlines from the Middle East, miss the bigger trend.
“It’s the ongoing decline in the value of paper money. Gold isn’t going up. Paper money’s going down. That’s what it reflects. And that’s your primary driver.”
He suggests a simple exercise: take a chart of the money supply over the past 50 years and set it beside the gold price. Gold’s long advance, with its occasional sharp pullbacks, is the mirror image of the decline in the currency it is priced in. He sees silver’s case the same way. Silver isn’t just catching up with industrial demand. Like gold, it is reflecting doubts about paper money.
Asked whether this marks the beginning of the end of the post-1971 fiat system, Oliver doesn’t predict a date. He is clear, though, that he sees today’s situation as something other than a normal market cycle.
“This is not a come and go, oh, a mortgage crisis comes and goes. This is something far more significant that will change a lot of things that don’t even involve markets going forward.”
He thinks the outcome could be a world that rethinks money itself. Fiat currencies and central banking, in his view, have mostly produced boom-and-bust cycles. He raises the idea of a return to gold-backed money, whose supply governments can’t expand overnight and whose price they can’t set. And once that shift begins, he says, it “can happen quickly.”
The Takeaway
Oliver’s message is that the headlines driving short-term price swings are not what matter most for gold and silver. The Fed’s rate decisions, the latest stock market moves and the daily news cycle can all push prices around. In his view, though, none of them sets the direction. What sets it is the long-term erosion of paper money, which is now coming to the surface as a crisis in the government bond markets of the world’s largest economies.
His momentum work says this year’s sell-off has hurt gold and silver without breaking them. The long-term structures that broke in 2011 are still intact today. In his view, silver’s breakout against gold is the start of a much larger move, not the end of one.
Oliver doesn’t claim to get every call right. He says openly that he got the timing of this year’s sell-off wrong. But his record of buy signals, and his willingness to put specific levels on the table, give investors clear markers to watch. If he is right, he warns, the investors waiting for the bearish consensus to be proved right will be the ones chasing the next move.
