

One of the keys to trading is keeping emotions out of your decisions. For the most part, that is the way to go. But there is one exception worth watching. Understanding how other traders respond emotionally to certain prices, such as round numbers in trading, can help you read the market.
Many traders use mechanical or automated systems to reduce emotional decisions. Yet even in a market dominated by algorithms, familiar price levels continue to attract attention.
Why should EURUSD at 1.1000, USDJPY at 160.00, gold at 4000 or US500 at 7500 influence confidence?
These numbers give traders a shared reference point. What happens around them can influence expectations, trigger orders and change the trading tone.
Why Round Numbers in Trading Affect Sentiment
Round numbers in trading are easy to remember. Traders discuss them, set targets around them and watch how prices behave when they are reached.
Their influence comes from several related behaviors.
- They affect confidence. Above a round number can feel bullish, while below it can feel bearish, especially after a sharp move.
- They shape expectations. Traders may take profits near the number, anticipate a bounce or position for a breakout.
- They attract orders. Entries, profit targets and protective stops can turn a psychological reference into buying or selling pressure.
- They make failure visible. A break that quickly reverses can shake confidence. Holding beyond the number can encourage expectations of further progress.
The round number attracts attention. The market’s response tells you which side is having difficulty following through.
For traders, especially intraday traders but longer-term ones as well, there is another reference level that I watch closely.
I call it the “50” level.
What Is the 50 Level?
By the “50” level, I mean prices such as these.
| Currency pair | Examples |
| EURUSD | 1.1150, 1.1250 |
| GBPUSD | 1.3250, 1.3350 |
| USDJPY | 158.50, 159.50 |
These are halfway points between nearby round numbers. EURUSD 1.1150, for example, sits midway between 1.1100 and 1.1200.
My interest comes from watching how the trading tone changes around these levels. A market can look comfortable above a 50 level, then suddenly feel vulnerable when it slips below. A failed break can produce another quick shift in confidence.
That reaction is worth observing, particularly when the level lines up with the existing chart structure.
Why the 50 Level Can Matter
A Midpoint Becomes a Shared Reference
The halfway point gives traders another place to assess progress.
If EURUSD is rising from 1.1100 toward 1.1200, its ability to move through 1.1150 can influence expectations about whether the recovery has more room to run.
Does the market hold above it? Does the move stall? Does price briefly cross the level and then retreat?
Those responses help reveal whether buying or selling pressure is gaining the upper hand.
Orders Can Reinforce the Psychological Level
Traders may place profit targets, entries or protective stops around familiar prices.
When enough participants focus on the same area, their orders can influence the next move. Profit-taking may interrupt a rally, while triggered stops may help accelerate a break.
Options Strikes Can Add Another Influence
A 50 level may also coincide with an options strike. Where significant options exposure exists, hedge adjustments can influence buying and selling in the underlying market.
Depending on positioning, those flows may dampen price swings or reinforce them.
EURUSD Example of the 50 Level
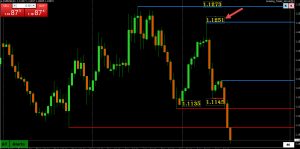
In my November 10, 2026 example, EURUSD was correcting higher within a broader downward move.
For the recovery to challenge that structure, 1.1273 needed to be taken out.
Instead, the correction stalled at 1.1251, just above the 1.1250 level. EURUSD briefly crossed the 50 level but failed to hold above it.
The sequence was straightforward.
1.1134 → 1.1251 → 1.1145
The attempted recovery failed to build momentum above 1.1250, and sellers regained control.
The useful observation was the failure to follow through. Crossing the level by a small amount did little to change the broader picture when the market could not sustain the move.
EURUSD 4 HOUR CHART dated November 11, 2026, covering the prior day’s price moves.
Why I Focus on Currency Prices
Currency pairs give traders widely followed price references across a global market. That makes pivotal levels useful places to compare buying and selling pressure.
However, spot forex is decentralized. There is no single universal forex price feed. Quotes from different providers are usually very close, with the main difference being the bid-offer spread.
For that reason, I watch the response around a level rather than treating the last quoted digit as decisive.
In my experience, liquid pairs such as EURUSD often provide clear examples of this behavior. I also watch these references in spot gold. Stock-index and other CFDs offer a different challenge, given their different price feeds, but price action around the 50 level is still worth watching.
How to Read the Reaction Around a 50 Level
Holding Above or Below Can Establish a Bias
A market that breaks above a 50 level and holds it on a pullback is behaving differently from one that repeatedly slips back below.
The same applies in reverse. Failure to recover a level after breaking below it can leave sellers with the advantage.
The response matters most when it fits the surrounding momentum and support or resistance structure.
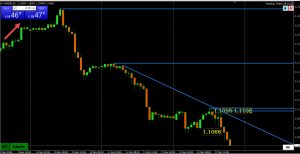
EURUSD 4 HOUR CHART dated November 11, 2026,:
Fall from 1.1251 has seen EURUSD 1.1050 attract like a magnet with the level now pivotal in dictating whether or not there will be a run at the key round number 1.10..
A Failed Break Can Change the Trading Tone
A move above a level can attract breakout buyers. If price quickly retreats, their confidence may weaken and some may exit.
A failed break below can have the opposite effect, putting pressure on traders who sold the move.
Watch whether the market can extend the break and whether the next correction holds. That gives you more information than the initial crossing.
The One Word That Makes Markets Move: Failure
Repeated Crossings Can Show Indecision
Sometimes price moves back and forth through a 50 level without developing momentum.
In that environment, the level may be the center of a trading range. Repeated crossings suggest neither side has established enough control to sustain a move.
Recognizing that behavior can help you avoid assigning too much significance to each small break.
Use the 50 Level With the Broader Chart
I use the 50 level to help assess the trading tone alongside the trend, prior highs and lows, and the market’s ability to follow through.
A few questions keep the focus on behavior.
- Is the move following the prevailing direction or correcting against it?
- Does the 50 level coincide with another chart reference?
- Does a break attract further buying or selling?
- Does the market hold the level when it is tested again?
- Where would the trading idea be invalidated?
What still interests me is that these familiar levels continue to influence confidence in a world of algorithms and automated execution.
Watch your own reaction as a market moves above, below and back through a 50 level. Then watch what price actually does.
The opportunity comes from recognizing when expectations are being met and when they are failing.
The post The Power of 50: How Round Numbers Shape Trading Sentiment appeared first on Forex Trading Forum.
